Environmental Impact Analysis of Paper-Based vs. Software-Based Business Cards
Abstract
In our quest for sustainability and eco-conscious choices, it’s essential to evaluate even the smallest aspects of our professional lives, like business cards. Let’s delve into the environmental impact of business cards and conduct a comparative life cycle assessment between traditional paper-based cards and their modern, digital counterparts commonly known as digital business cards.
Understanding the Life Cycle Assessment
The Life Cycle Assessment (LCA) is a valuable tool that allows us to scrutinize the environmental footprint of various products and processes. In our case, we focus on business cards, a staple in networking and professional communication.
Two Business Card Options
Our assessment centers around two distinct business card options: the time-tested paper-based cards and the increasingly popular digital business cards(software-based), commonly accessed via smartphones.
Comparing Production, Distribution, and Use
To comprehensively evaluate these options, we analyze their life cycle impacts across three critical phases:
i) Production
We investigate the resources, energy, and emissions associated with manufacturing paper-based business cards and the software infrastructure for digital business cards.
ii) Distribution
This phase involves assessing the logistics and energy requirements for the distribution of paper-based cards versus the digital dissemination of software-based cards.
iii) Use
We explore how these cards are employed in professional settings, considering factors like disposal, longevity, and usability.
Assessing Environmental Impacts
Our objective is to determine which of these systems has a more favourable environmental profile. We gauge this by analyzing the total energy consumption, Greenhouse Gas (GHG) emissions, and toxic releases associated with both paper-based and software-based business cards.
Two-Stage Life Cycle Assessment
To ensure a comprehensive evaluation, we conduct a two-stage LCA, considering alternating functional units. We compare the environmental impacts of the two systems, focusing on their energy consumption, GHG emissions, and toxic releases.
Small-Scale vs. Large-Scale Considerations
Our assessment acknowledges that the environmental impact may vary depending on the scale of operations. We assess the scenarios for both small-scale functional units and more likely large-scale (real-world) functional units to offer a balanced perspective.
Aiding Business and Consumer Choices
By comparing these two business card systems, we aim to provide valuable insights for businesses and consumers. We recognize that networking and professional connections are essential, but so is making environmentally conscious choices.
Stay with us as we delve deeper into this comparative assessment, helping you make informed decisions about your business networking options.
1. Introduction
In today’s digital age, everything goes online, from books to billing systems. Even traditional business cards have digital versions now. We’re here to compare the old paper-based ones with the new digital ones.
While people have compared digital and paper stuff before, like books and emails, nobody seems to have looked at business cards. They’re a big deal; in 2012, people printed about 10 billion of them!
Here’s the thing; digital technology can help save energy and reduce pollution, but it also uses lots of energy. For example, when you search on Google, it creates carbon emissions.
Back in 2002, the technology industry caused 530 million tons of CO2 emissions. By 2007, that grew to 620 million tons, and it reached approx 1.43 billion tons by 2020. That’s a lot of emissions!
So, we’re here to see how eco-friendly business cards are in this digital world. Stick around to find out!
2. Background and Related Work
Before we dive into the environmental impact stuff, let’s talk about how we measure it. There are methods like ISO LCA and Environmental Product Declarations (EPD). These help us understand how things affect the environment.
But, they’re not perfect. EPD, for instance, doesn’t consider everything, like where stuff goes when we’re done with it. ISO LCA is better, but it has some problems too.
Sometimes, it’s hard to get good data for these assessments, which makes things uncertain. This is especially true when we’re looking at things like paper business cards and their digital counterparts. They’re kind of unique, and it’s tricky to compare them.
Another thing is that when we look at the impact of technology products, we often forget about the software part. We focus on making gadgets, but we don’t think much about the software that runs on them. We think we should look at that too.
Lastly, we use a method called Economic Input Output (EIO) to get more data when we don’t have enough. It’s like connecting the costs of making things to how they affect the environment. It’s helpful but doesn’t always give us all the details we need.
3. Business Card Systems
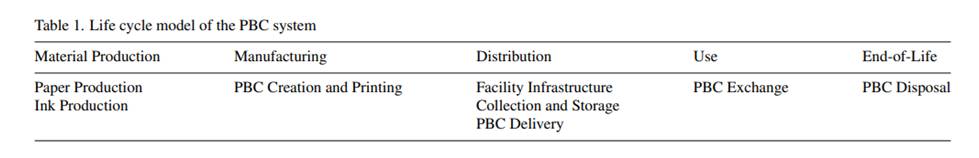
Now, let’s talk about business cards. Even though we live in a digital age, paper business cards are still a big thing. People exchange them when they meet in person. But, getting these cards involves a long process. We start by taking stuff from the Earth, then we make paper, print on it, and transport it. Finally, we use it and, eventually, throw it away.
On the other hand, we have digital business cards (DBCs). These are like the digital versions of paper cards. We exchange them online using special software. There are different apps for this, like Card Flick, CamCard, and more. For our study, we used an app called Infold (version 0.1). It does just one thing – helps you create and share digital business cards.
In the next section, we’ll dig deeper into how these systems work.
4. Methodology
Now, let’s get into the nitty-gritty of how we did this study.
We wanted to compare the environmental impacts and energy usage of paper-based business cards (PBC) and digital business cards (DBC). To do this, we used a two-stage analysis.
4.1. General Assumptions
First, we made some general assumptions that applied to both stages of our analysis. Here are the key points:
- Customers either use PBC or DBC software to create and exchange business cards.
- Customers use up all their printed business cards in a year.
- Each printed business card weighs about 1.8194 grams.
- We measured the energy used by the DBC software, and it’s about 0.002778 watt-hours per exchange.
- Each DBC is about 10 KB in size, and an exchange between two customers transfers 40 KB of data over the Internet. We estimated that 1 MB of internet traffic uses 5.9 watt-hours, which is an upper limit.
- We don’t account for energy used in DBC software updates.
- We do consider the environmental impact of the server used for the DBC system, but only for one year.
- The estimated energy consumption for the DBC system’s server is about 45 watt-hours.
- We don’t consider the production and manufacturing of smartphones used with the DBC system since they have many functions beyond the DBC software.
- We also ignored additional environmental impacts and energy use associated with the internet’s components and devices, except for those specifically used for exchanging DBCs.
4.2. Functional Unit
In LCA, we need to define a functional unit to compare products. In this study, we compared DBC and PBC products on a one-to-one basis. Each exchange of a DBC or PBC between two customers was considered as one unit. To get a comprehensive view, we looked at two cases: one with 1,000 exchanges and another with 33,000 exchanges between customers in both systems. The second case is based on the annual use of business cards at the Masdar Institute of Science and Technology.
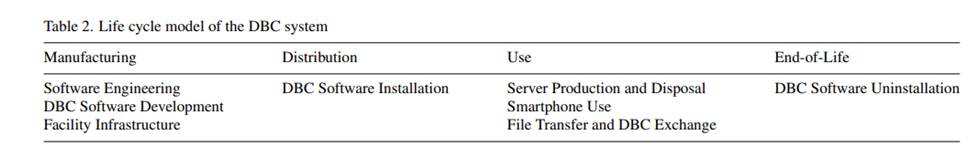
The boundaries for the DBC system are different from traditional industrial products. The DBC system’s life cycle is similar to that of a digital product. It involves software development, deployment, use, and end-of-life disposal.
In the next sections, we’ll delve deeper into our findings and what they mean.
5. Second Stage Analysis
Now, let’s dive into the details of our second-stage analysis, where we really got into the complexity of environmental impacts.
5.1. Life-Cycle Inventory
For this part of our study, we used SimaPro 7.3 software and the EcoInvent 3.1 database, with data from the U.S. in 2004. We focused on quantifying inputs and outputs in both the PBC and DBC systems.
We won’t delve into all the details here, but the results confirmed what we found in our screening analysis. In the case of 1,000 exchanges, the DBC system emitted only about 1.7 times the amount of CO2 equivalent emissions compared to the PBC system. Similarly, the DBC system’s energy consumption was only three times higher than the PBC system’s.
However, when we looked at 33,000 exchanges, the difference between the two systems became more noticeable. This suggests a few things: (1) the environmental impact of the DBC system is heavily influenced by the development of the DBC software and the manufacturing of server hardware, (2) the environmental impact of the PBC system depends largely on the number of exchanges, and (3) the PBC system’s scale economies are significantly lower than those of the DBC system.
5.2. Life Cycle Impact Assessment
In this phase, we assessed the environmental impacts and impact categories of both the PBC and DBC systems throughout their life cycles.
For the case of 1,000 exchanges, the environmental impact of the PBC system was slightly lower than that of the DBC system. Specifically, the DBC system emitted nearly twice as many global warming emissions and acidification-related chemicals as the PBC system. It also emitted nearly twenty times more ozone-depleting substances.
However, when we considered 33,000 exchanges, the tables turned. The overall environmental impact of the PBC system was about 30 times higher than that of the DBC system. In almost all environmental categories, the PBC system had worse impacts than the DBC system. This was because the manufacturing and use stages of the DBC system’s life cycle were amortized over a high number of exchanges.
In summary, our findings suggest that the more exchanges there are, the more the impacts of the manufacturing and use stages of the DBC system’s life cycle are amortized.
Conclusions
In this study, we compared paper-based and software-based business card systems, considering their environmental impacts and energy usage. Here’s what we found:
- For small-scale use, paper-based cards are more eco-friendly and energy-efficient.
- But in real-world scenarios with lots of exchanges, digital cards are greener.
The environmental impact of digital cards comes from electricity use and server production, while paper cards are affected by electricity and paper production.
Our goal isn’t to favour one but to give people and businesses the info they need to make eco-conscious choices. Plus, our study sheds light on assessing the environmental impact of software, which can help create greener tech in the future.
Source of Research
This study draws information from:
- The 5th International Conference on Sustainable Energy Information Technology (SEIT 2015)
- A Two-Stage Comparative Life Cycle Assessment of Paper-Based and Software-Based Business Cards
- Authors: Areg Karapetyan, Waheeb Yaqub, Aram Kirakosyan, Sgouris Sgouridis
- Department of Electrical Engineering and Computer Science, Masdar Institute of Science and Technology, Abu Dhabi, UAE